
Laravel က log ကို logstash ကို ပို့ဖို့ စမ်းနေတာ ကြာပြီ။ သေချာအချိန်ပေးပြီး မစမ်း ဖြစ်ဘူး။ ကျွန်တော် ဖန်တီးချင်သည့် infra က အောက်ကလို ပုံပါ။
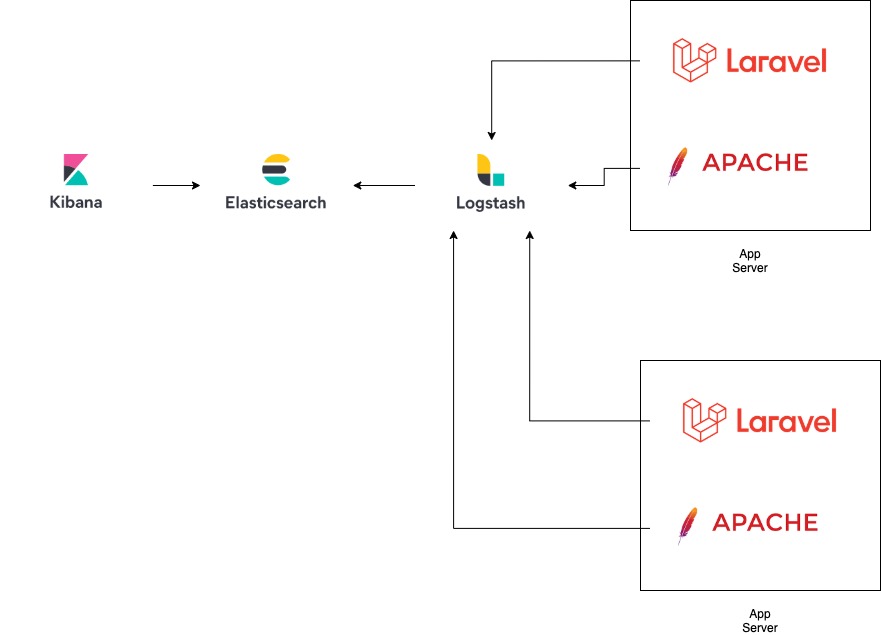
Laravel နဲ့ Apache က log တွေ အကုန် logstash ကို ပို့။ logstash ကနေ elastic search ကို ပို့။ ပြီးရင် kibana နဲ့ filter လုပ်ကြည့်ဖို့အတွက်ပါ။
အခုတော့ ရသွားပါပြီ။ အဓိက logstash မှာ plugin တွေ သွင်းရတာ ကို မသိခဲ့တာပါ။
Logstash အတွက် config ကို အောက်ကလို ရေးပါတယ်။
input {
    tcp {
        port => 9425
    }
}

filter {
    json {
        source => "message"
        add_tag => ["tag"]
    }
}
output {
    elasticsearch {
        "hosts" => "http://127.0.0.1:9200"
        "index" => "laravel-%{+YYYY.MM.dd}"
    }
    stdout{}
}
သုံးထားသည့် plugin တွေက input မှာ tcp , filter မှာ json, output မှာ elasticsearch နဲ့ stdout သုံးထားပါတယ်။ stdout ကတော့ ပြန်စစ်ဖို့ အတွက်ပါ။
cd /usr/share/logstash/bin
./logstash-plugin install logstash-input-tcp
./logstash-plugin install logstash-filter-json
./logstash-plugin install logstash-output-stdout
./logstash-plugin install logstash-output-elasticsearch
ပြီးရင် ဖန်တီးထားသည့် config file နဲ့ အခု လို run ကြည့်ပါမယ်။
cd /usr/share/logstash/bin
./logstash -f ~/udp.conf
udp.conf က ကျွန်တော် ဖန်တီးထားသည့် config file ပါ။
ပြီးရင် message.json မှာ အောက်ကလို ရေးထားပါ။
{"message" : "testing","tag" : "just"}
စမ်းပြီး ပို့ကြည့်ပါမယ်။
nc 127.0.0.1 9425 < message.json
error မတက်ပဲ stdout မှာ ပြပြီ ဆိုရင်တော့ အလုပ်လုပ်ပါပြီ။
ဒါဆိုရင် control + c (win,linux) , command + c (mac) နှိပ်ပြီးတော့ run ထားသည့် logstash ကို ပိတ်ပါ။
mv udp.conf /etc/logstash/conf.d/
service logstash restart
အခုဆိုရင် logstash က ready ဖြစ်ပါပြီ။ Kibana နဲ့ Laravel ကို တော့ မနက်ဖြန်မှ ဆက်ရေးပါတော့မယ်။
One response to “Logstash and Laravel (Part 1)”
[…] Part 1 ဖတ်ရန် […]